Revmatics Retail Intelligence
Turning a data lake into actionable information based on retail and AI insights
Problem
Revmatics had a data problem in reverse. We had granular live data on retail sales and inventory at the store-and-SKU level across major US retailers (Walmart, Kroger, Walgreens, others), plus the customer side: Shopify orders, landing-page conversions from our own page-builder product, Meta Ads, GA4. Customers had paid for that data. They couldn't use it.
Before this product, the workflow was: pull the data into Excel, give it to the customer, hope they could read it. We hired a data analyst to do this manually. They couldn't scale across multiple brands. The result was a dataset we technically owned but couldn't sell, because we had no way to turn raw numbers into something a CMO or VP of Sales could act on.
Role
Lead engineer on the Innovation Team build. I owned hosting, integrations, application architecture, the entire frontend, the AI layer, and the prompt system. A data analyst contractor handled the data pipeline and JSON shape: getting the raw retail and ad data into a queryable form. Product direction came from the CRO, CMO, and CTO; engineering decisions were mine. Once we had paying customer interest I was on sales calls providing the technical demo while the sales team closed.
Approach
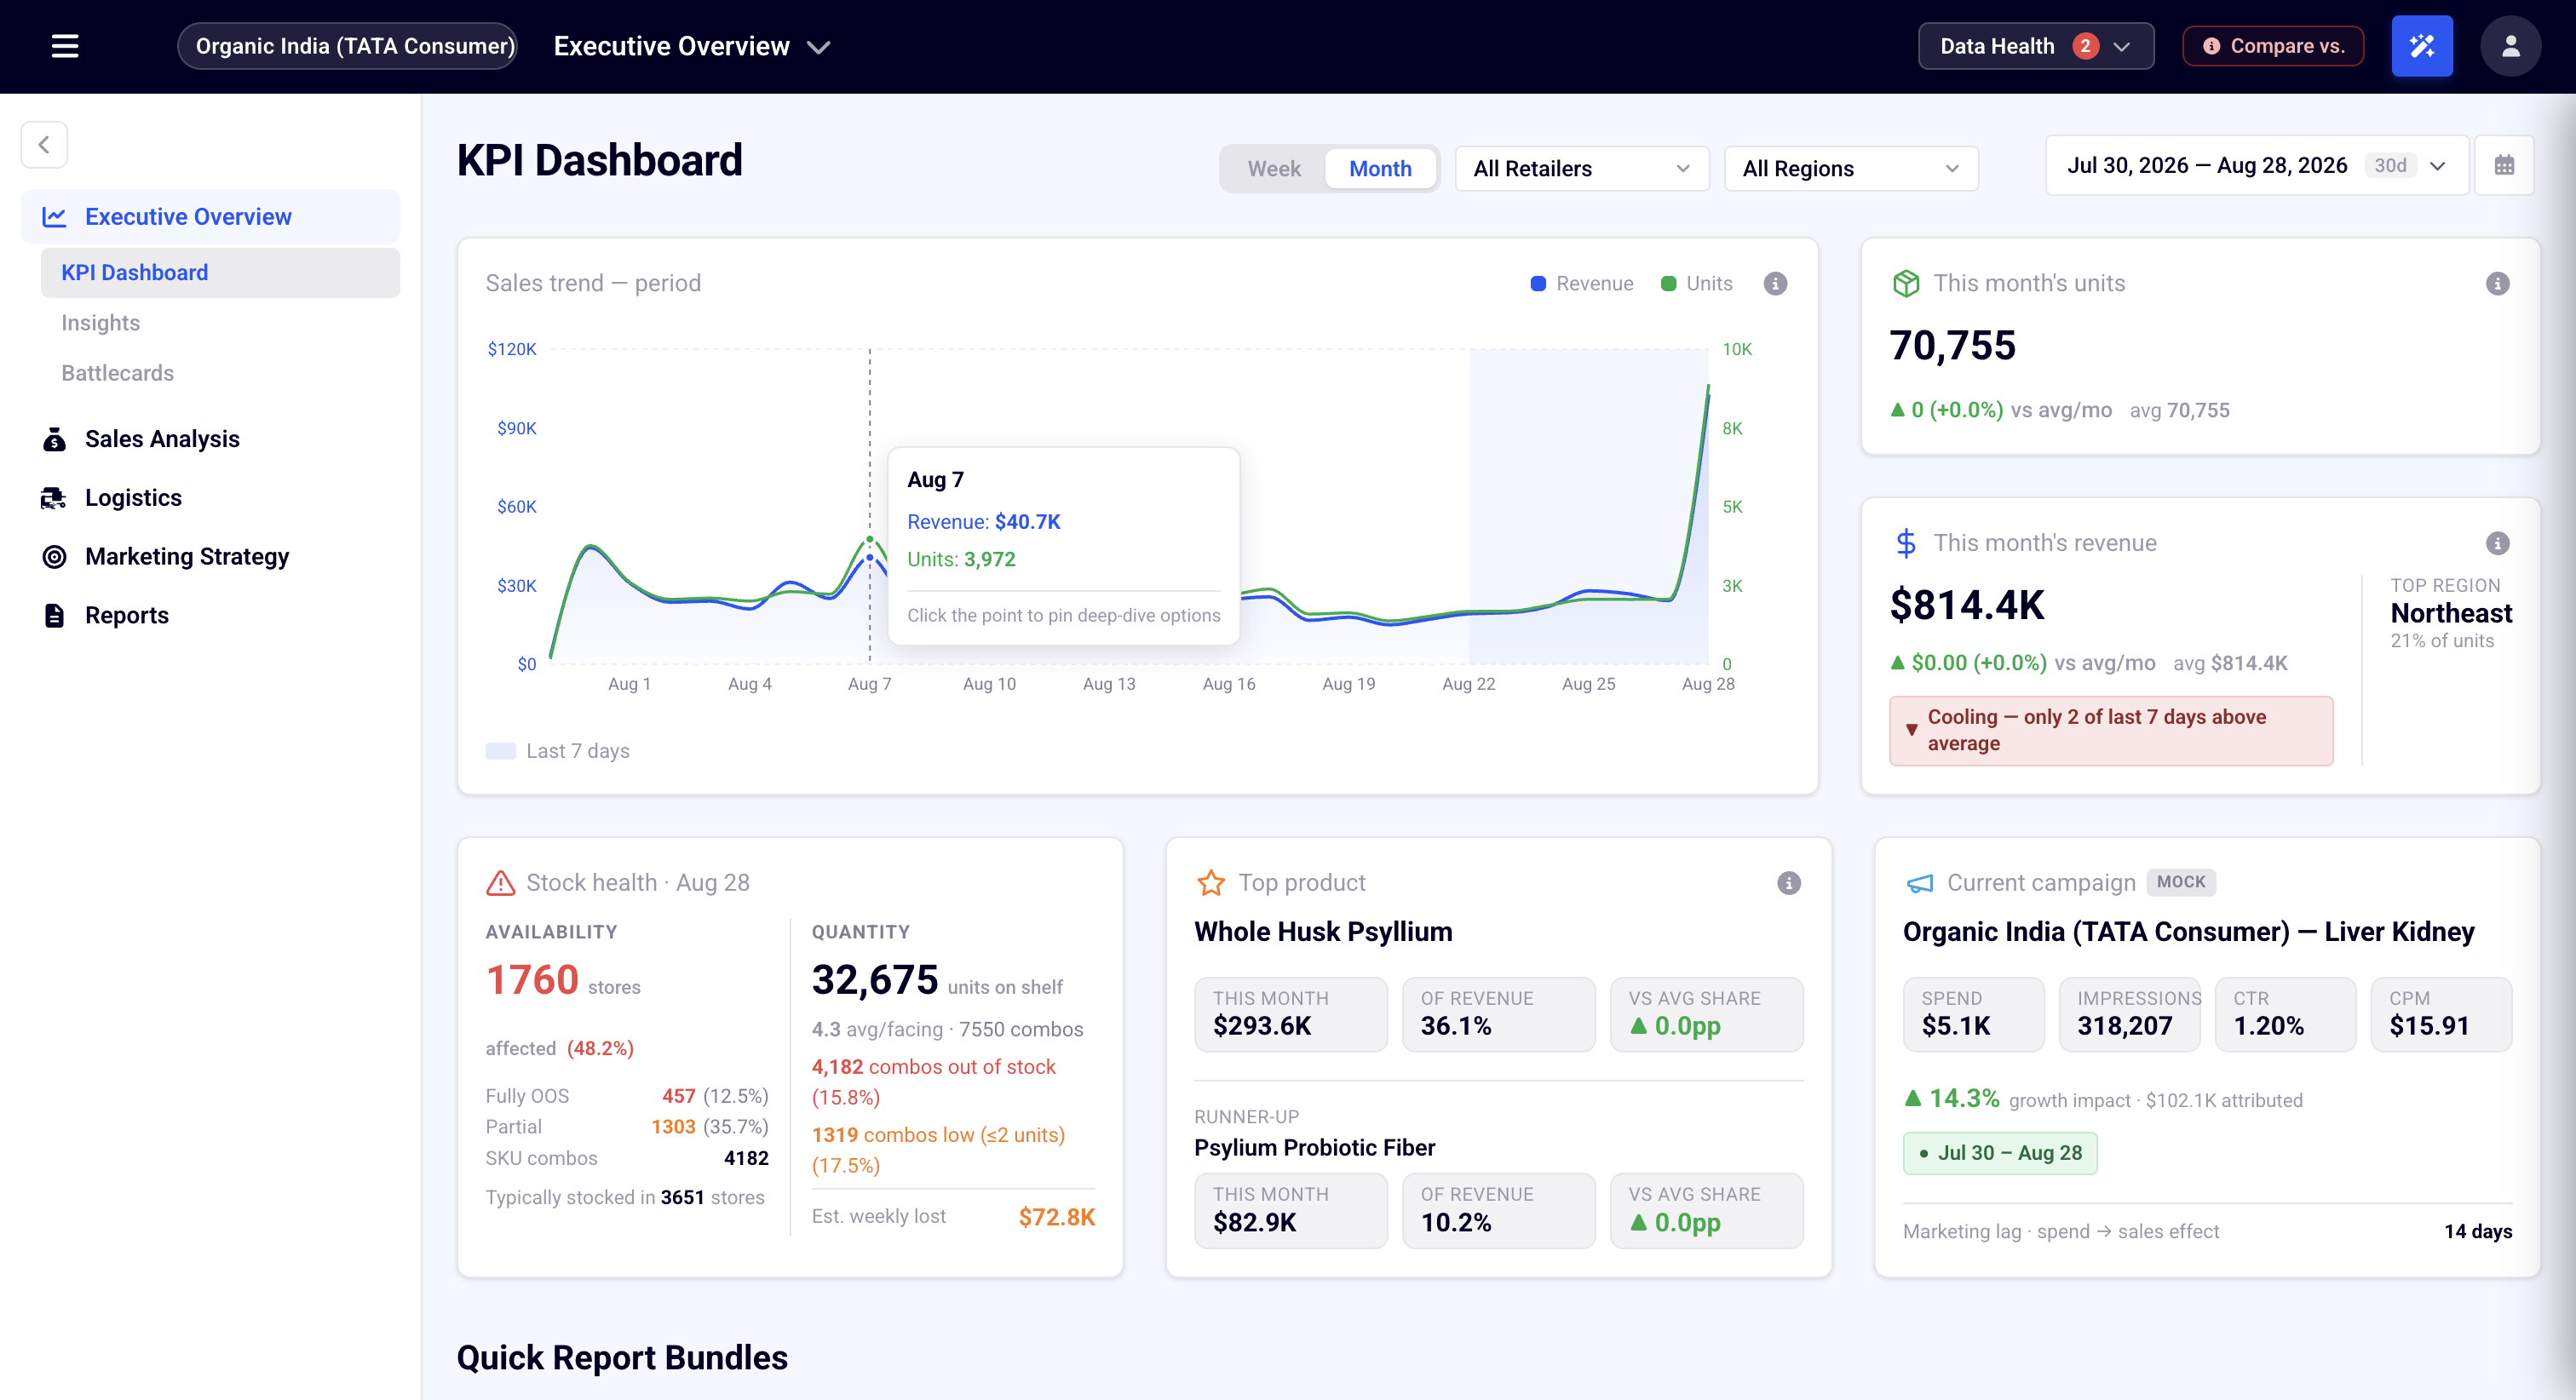
The dashboard has more than 40 tabs covering inventory, retailer velocity, regional sales, ad spend, demographics, pricing, and other parts of the business. Customers can review the charts themselves or use the Stream panel to get a short written summary of what needs attention.
When someone opens a tab, the frontend prepares the data for that section. For the restock tab, that means store names, inventory counts, sales rates, and estimated stockout dates. It also adds a short summary of the strongest and weakest results from the other tabs. The request goes to Claude Haiku 4.5, which returns two or three sentences for the Stream panel. The customer can then rate the response or ask a follow-up question.
I wrote a separate prompt for every dashboard tab because low inventory, weak ad performance, and pricing problems should not be analyzed the same way. Each prompt tells the model which numbers matter and how to explain them. A shared set of instructions asks for the finding, the likely cause, and a specific next step. It also blocks vague words such as "consider," "might," "notable," and "significant."
One response looked like this:
"Feastables Dark Chocolate at Kroger in DMA 539 (Tampa) will hit zero inventory within 6 days at 47 units/week, costing about $140/week in lost revenue across 3 stores. Call the Kroger Division 43 rep today to expedite a restock PO before the weekend."
I do not send the model the entire dataset. It only receives the rows and summary needed for the current request, which limits the numbers it can reference. We do not yet check every generated number against the source payload after the response, so that is still an area I would improve.
The Insights Dashboard cards use Claude's JSON mode. Every response has to match a fixed structure with a severity, category, headline, detail, tab index, and tab label. That keeps the cards consistent and lets the frontend render them without trying to parse free-form text.
I also added a thumbs-down button to every insight. Customers can mark a response as too vague, based on the wrong data, overly cautious, missing a useful next step, or not relevant. We review that feedback manually. It is not used for fine-tuning yet, but it gives us real examples of where the responses are falling short.
Outcome
We went from the initial idea to a working internal demo in about two months, then started showing it to customers and improving it based on their feedback. The dashboard gave Revmatics a product it could sell on top of retail data that had previously been delivered through spreadsheets.
Stack
React, TypeScript, Python, Flask, Claude Haiku 4.5 (prose insights), GPT-4o-mini (alternate path), JSON mode for structured cards, deployed on GCP.